Analytics
Know exactly what happens after you send.
Every document you share becomes a live data source. See who read it, where they hesitated, when a deal starts going cold — and exactly what to do next.
Start for freeNo credit card required
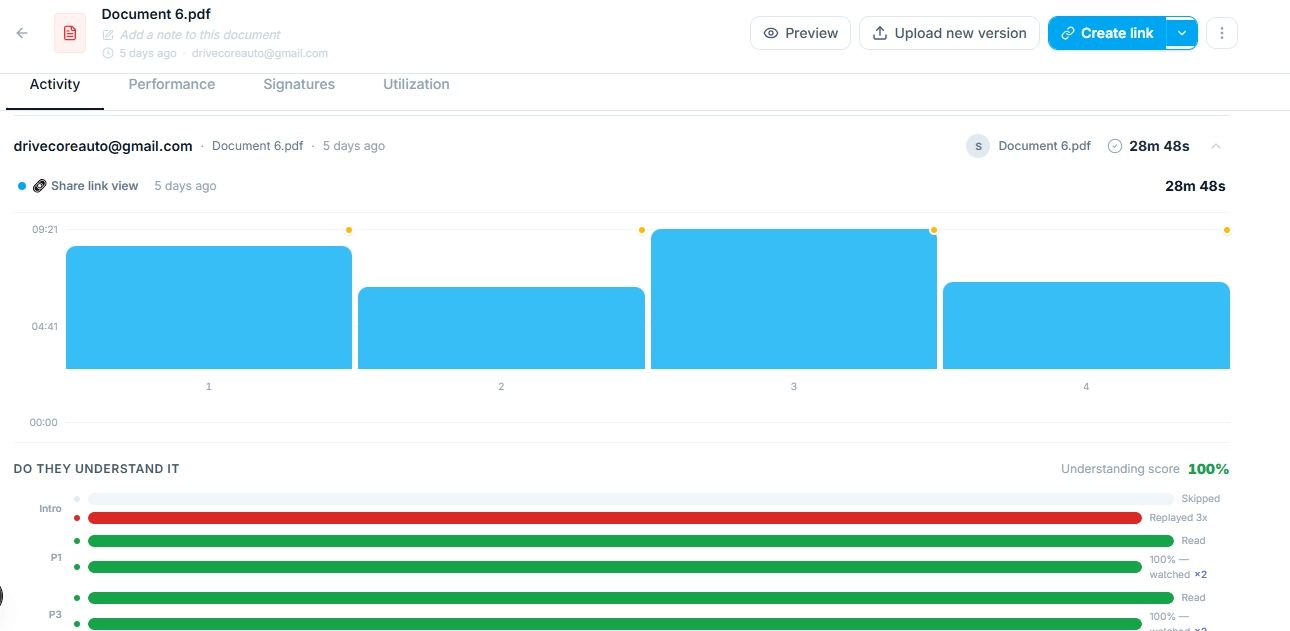
Page by page reading data
See how long each person spent on every page.
When someone opens your document a bar chart builds in real time showing their reading time per page. Tall bars mean they read carefully. Short bars mean they skimmed or skipped. Hover over any bar to see a thumbnail of that page and the exact time spent. You see this for every visitor individually — not averaged across everyone.
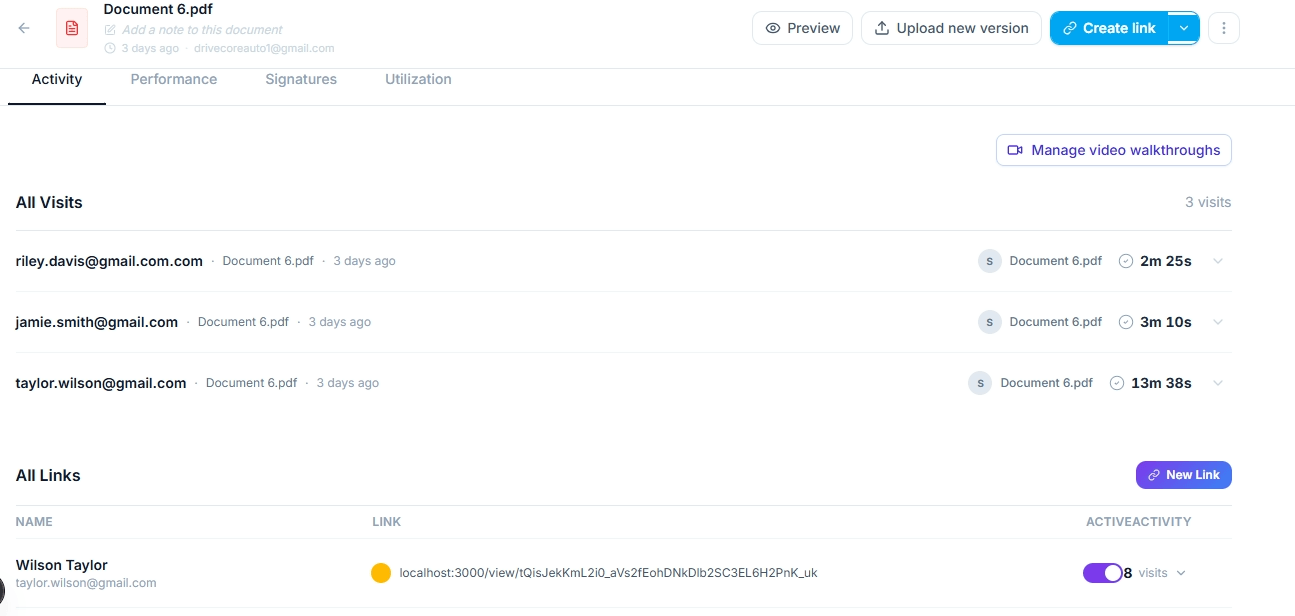
Visitor identity and history
Know who opened your document, not just that someone did.
Every visitor is identified by their email address — either captured at the gate before they open the link, or matched against your share link settings. You see their first visit, every return visit, total time spent across all sessions, and which pages they came back to. Multiple visits from the same person stack into one profile so you see the full picture of their engagement over time.
Understanding analytics
Reading time tells you how long. This tells you if they understood.
For every page that has a video walkthrough recorded, you see two bars per visitor — their reading time and how much of your explanation they watched. If someone watched your page 4 walkthrough three times you know that page needs a conversation. If they marked every page as clear and answered ready to move forward on the deal intent question, you know the timing is right to close.
Deal intelligence
Know where your deal got uncertain before they go quiet.
When a prospect re-reads the same page multiple times, jumps back to your pricing section, or returns to your document days later without responding — something is making them hesitate. DocMetrics surfaces these signals automatically. You see a dead deal score, the specific pages that caused uncertainty, and a recommended action so you know exactly when to follow up and what to say.

Real time notifications
Know the moment someone opens your document.
The instant a recipient opens your share link you receive a notification — in your dashboard, by email, and in Slack if connected. The notification includes their email, which document they opened, and what time. If they are viewing right now a live indicator appears on your dashboard. You always know when to follow up and you never have to guess whether they have seen it yet.
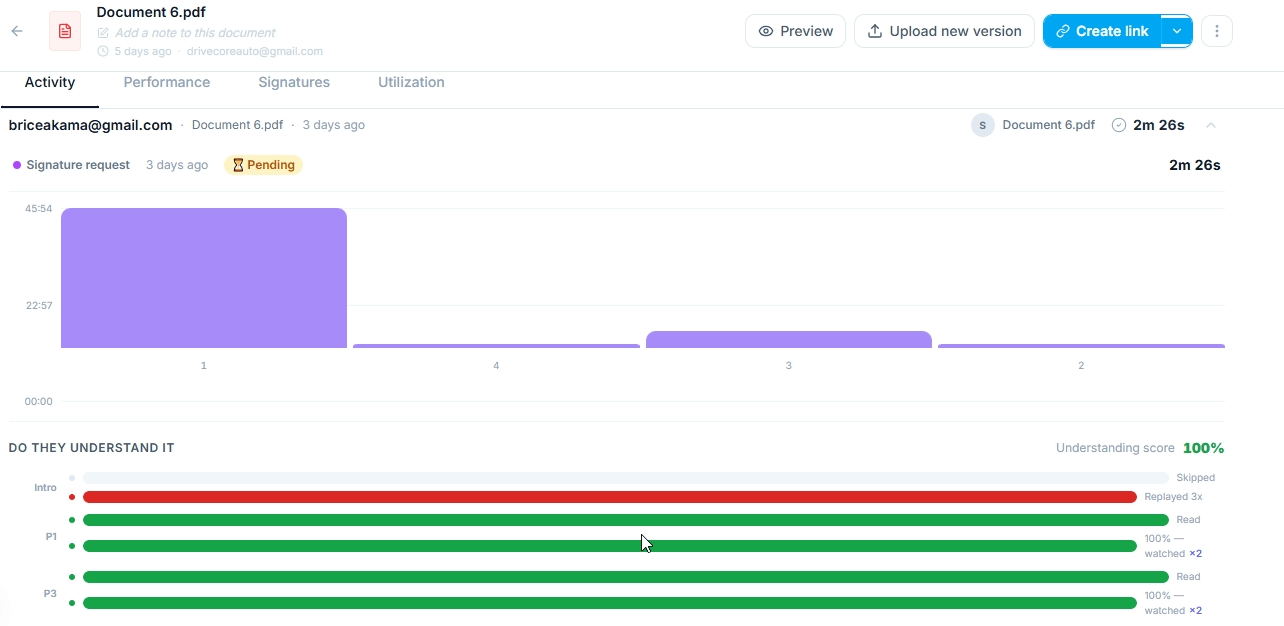
Signature analytics
Track the entire signing journey, not just the outcome.
For every signature request you see a funnel — how many recipients opened the document, how many scrolled to the signature field, how many started signing, and how many completed it. For each individual signer you see their reading time per page, their video walkthrough completion, and if they declined, the page they were on and the reason they gave.
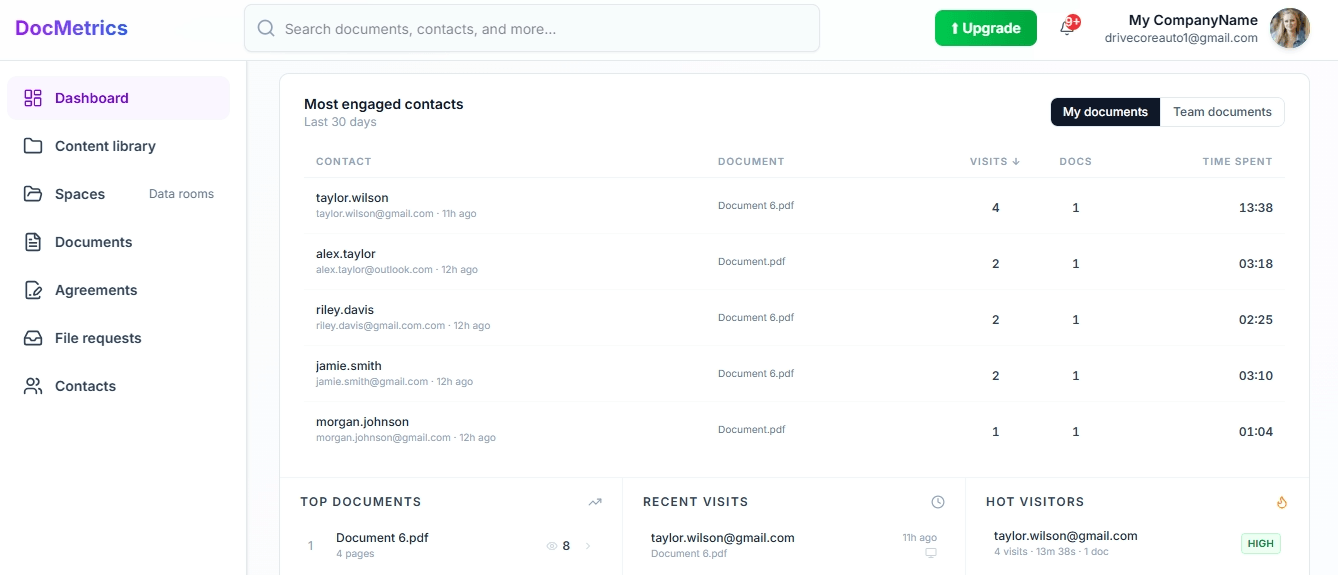
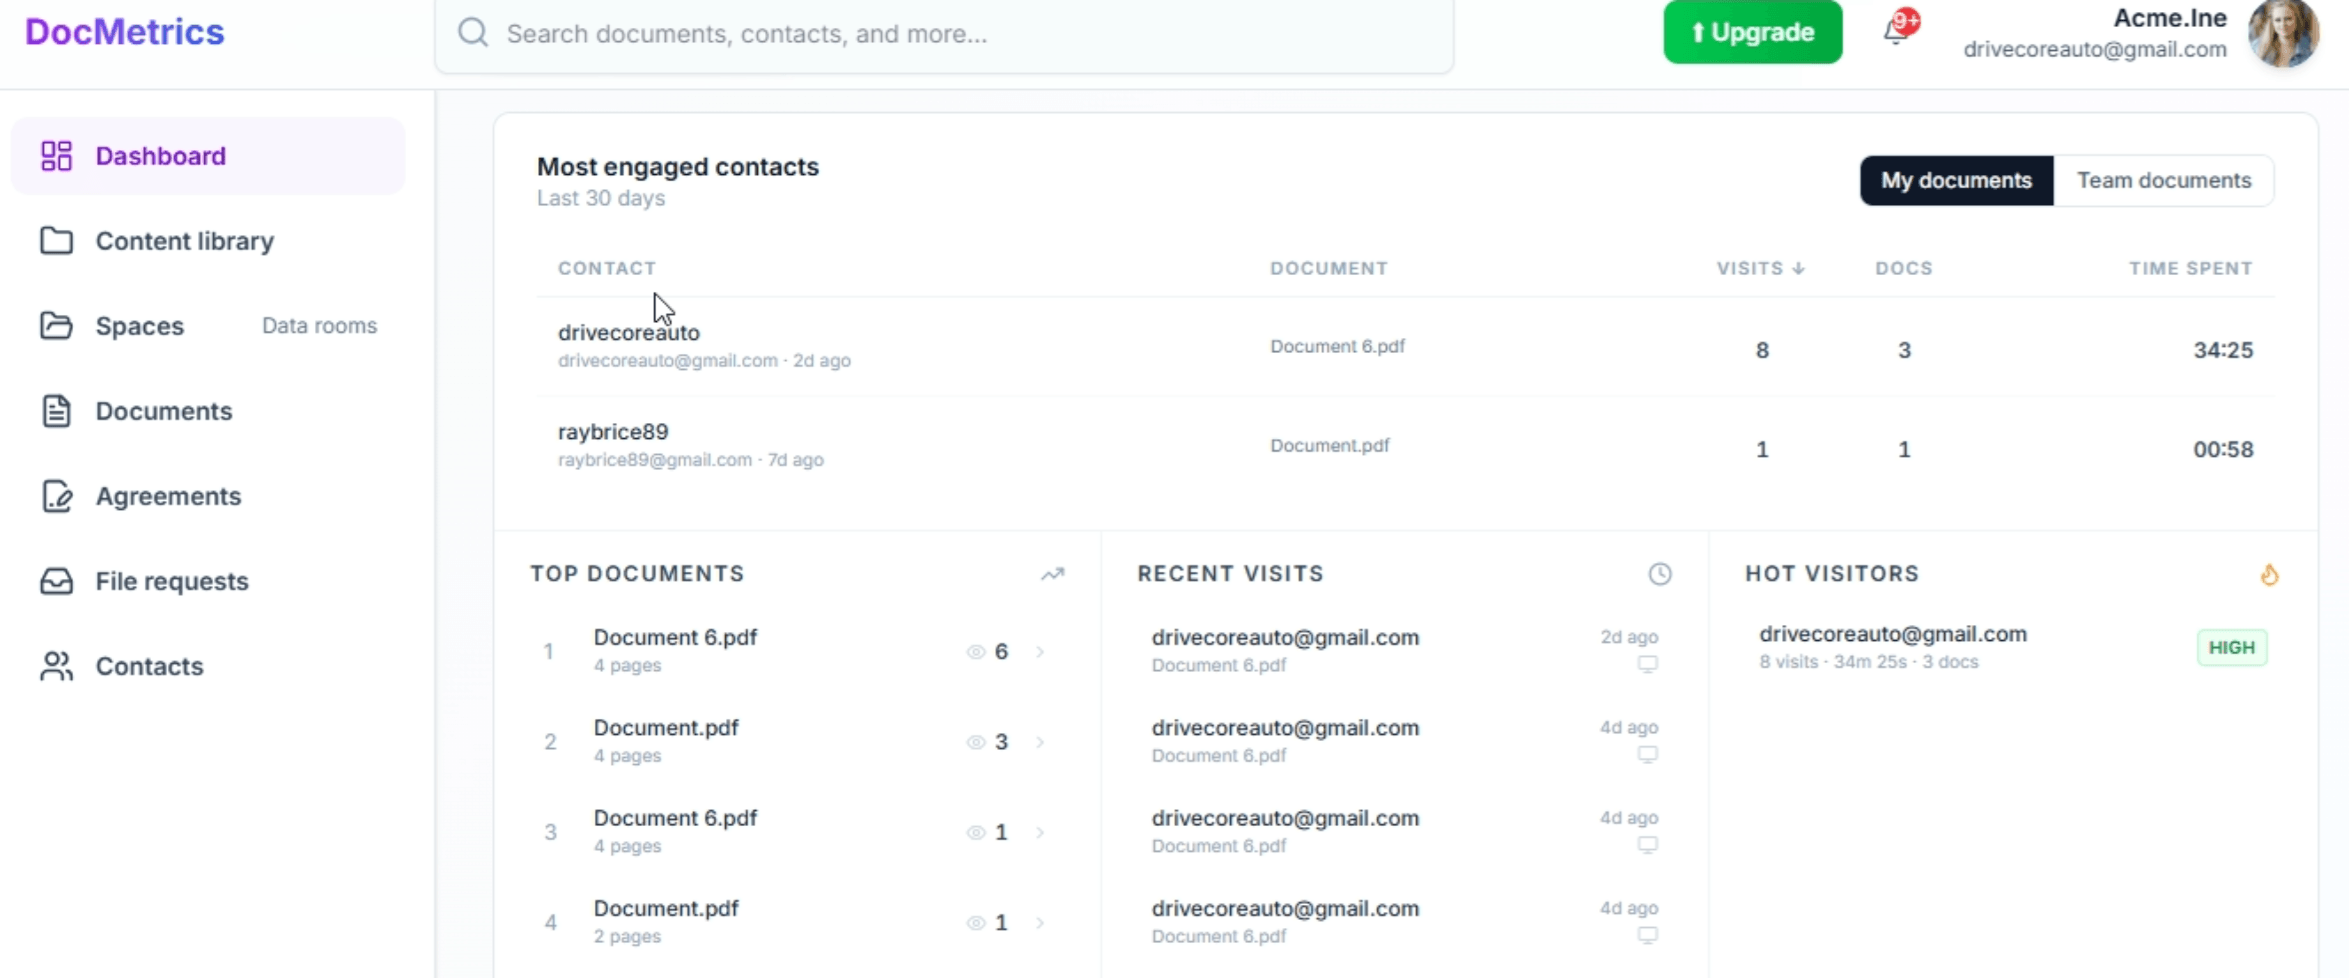
Dashboard overview
Your most engaged contacts, always at the top.
Your dashboard shows the contacts who have spent the most time across all your documents in the last 30 days — ranked by visits, total time, and number of documents viewed. Below that you see your top documents by views, your most recent visits in real time, and your hottest visitors by engagement score. Everything you need to know about what is happening across your entire document library, without digging.
See your own documents come alive.
Upload any PDF and share it. You will see your first analytics within seconds of your recipient opening the link.
No credit card required